
Understory vegetation
Environmental changes can quickly change the composition of the ground vegetation. The increased spread of species like blackberry (Rubus fruticosus agg.), common nettle (Urtica dioica), ferns (z.B. Pteridium aquilinum) and sedges (Carex sp.) in our forests is a major issue as it can impair regeneration. Nitrogen deposition, light availability and soil acidity promote the spread of these ruderals. Our investigations in the permanent observation plots showed that there is also a strong relationship between the coverage of blackberry and nitrogen deposition.
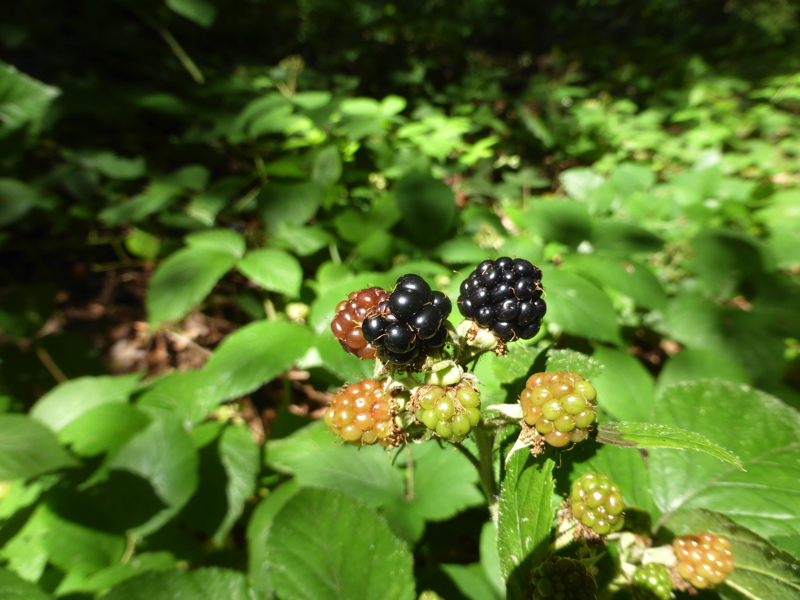
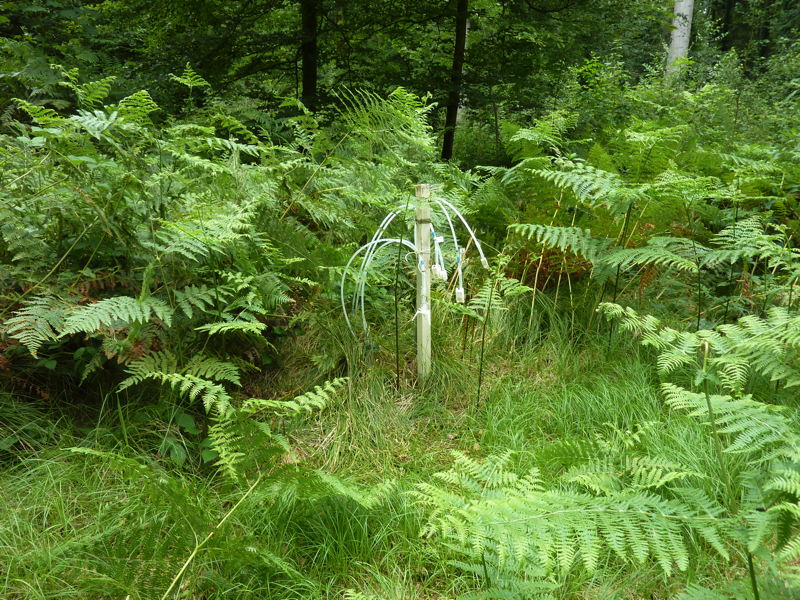
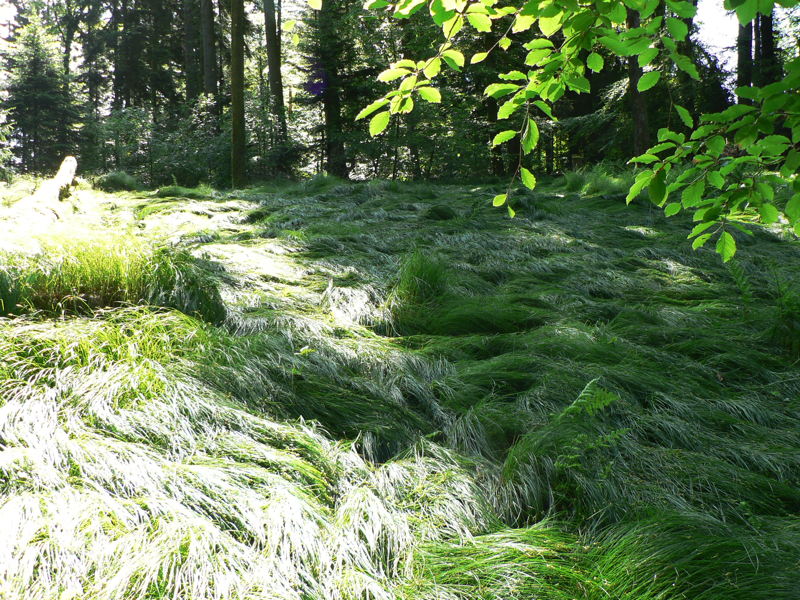

Blackberry (left), ferns (mid left), sedges (mid right) and common nettles (right).
Coverage of blackberry in relation to
nitrogen deposition (left) and soil pH (right). Stickstoffdeposition (links) und zum Boden-pH-Wert (rechts).
A ground vegetation survey in our permanent observation plots and a subsequent comparison of the data with soil chemistry allowed us to conclude that differentiation of the soil acidity is possible based on plant communities. In an ecogram, plant communities are usually arranged along gradients of soil acidity (x axis) and humidity (y axis). The position on the x axis is pretty well correlated with the base saturation in the upper soil (0-40 cm depth). Therefore, information on plant community, together with geology and soil suitability maps, was used for mapping of base saturation in forest soils. Below is an example from canton Zurich (see also our report 'Erfassung und Behandlung gefährdeter Waldstandorte').
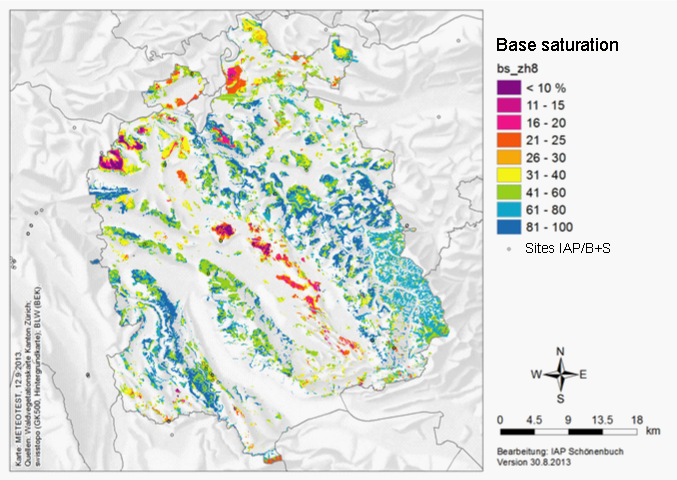
Left: Average measured base saturation in the upper 0-40cm (± 95%-confidence interval) for plant communities
with minimum four records in relation to the X axis of the ecogram. The x axis is linear in contrast to the pH scaling
of the ecogram; therefore, it represents pH values only at the outer extremes. Plant communities are indicated with
standard abbreviations.
Right: Map of soil base saturation in forest soils for the canton Zurich.